Oops! Something went wrong while submitting the form.
Product Design
Challenge | Health Record
A two-round design challenge: an electronic health record where doctors and nurses find the right patient among a thousand, and add clinical information by simply talking to it.
Doctors and nurses of a fictional practice platform, Not Ill Co., needed to find a patient by about 20 data points and then read and add clinical information, on a 4K desktop and on a phone.
What I did
Two rounds, and I listened to the feedback
Round one was strategy and research. The reviewers asked for less theory and more interface, so in round two I mapped the journey and the sitemap, then went from sketches to wireframes to hi-fi screens and a prototype.
The outcome
A searchable patient list and a dashboard you can talk to
Search with one filter at a time, cards or table, a patient dashboard ordered by urgency, and "Add with Voice + AI" so clinicians can dictate notes instead of typing them.
01The brief
Not Ill Co. wants to be the best all-in-one platform for medical practices: bookings, reminders, records, everything. The challenge was one part of it, the electronic health record (EHR).
The task was to help create a solution that supports medical practitioners in making better decisions, by accessing and capturing vital clinical information: the patient's history, examination notes, procedures, prescriptions, lab reports and more.
Scenario
About 1,000 patients
Doctors and nurses need a database of all past and current patients.
Task
About 20 search criteria
Find a specific patient by name, surname, gender, e-mail, last visit and more.
Requirements
Desktop and mobile
Work on a 3840 × 2160 desktop and on a 390 × 844 phone.
“How might we help doctors and nurses find the right patient in seconds, and capture what they see without slowing down care?”
My problem statement
02Round one: understanding the people
Round 1 · Strategy
I started with the product, the market and the users. I looked at other EHRs, interviewed a nurse at a large hospital in Vienna and sent a questionnaire to three doctors in Brazil.
Other players
Powerful, but hard to learn
Existing EHRs need training, have a steep learning curve, dated interfaces and too much on screen.
Interview
No time, no attention
Clinicians have no time for training. Older colleagues still prefer paper, and handwriting leads to errors.
Questionnaire
Always on the move
Doctors and nurses walk between rooms all day. Mobile is essential, a phone is small, a tablet fits.
Two personas: Dr. Sarah Matthews, a GP with 22 years of practice, and Mark Johnson, a critical-care nurse with 6 years in the ICU.What the interview and the questionnaire told me.
I closed round one with goals, success metrics and the main user flow: go to patients → find the patient → open the dashboard → read the history → add information. To keep the scope honest, I left GDPR and HIPAA out on purpose.
03The feedback that shaped round two
The reviewers invited me to a second round, with honest feedback: the thinking was there, the interface wasn't.
Round 1
Strategy
Market, research, personas, goals, metrics and user flows. Mostly text.
→
Feedback
“Show us the UI”
Too much theory, few visuals, no real journey, no hi-fi, not enough prototyping.
→
Round 2
Interface
Journey, sitemap, sketches, wireframes, hi-fi on desktop and mobile, and a prototype.
“This time around, we're particularly interested in seeing your wireframing and user interface (UI) design skills in full display.”
The reviewers, inviting me to round two
What they said, and what I did about it
Feedback
No real user journey
Answer: a journey map for doctors (and one for nurses), with pain points and opportunities per phase.
Feedback
A sitemap would help
Answer: a full information architecture, plus a structure for the patient dashboard.
Feedback
Wireframes were weak, no hi-fi
Answer: sketches, then wireframes, then hi-fi screens for the patient list, the dashboard and mobile.
Feedback
Search results in a table felt odd
Answer: cards by default, with a table one click away. A nurse later told me which one she'd use.
Feedback
Research skipped search
Answer: I focused round two on search and filtering instead of business scenarios.
Feedback
Not enough prototyping
Answer: clickable flows on desktop and mobile. You can try the mobile one below.
The feedback slide that opened my round-two presentation.
04A day with the EHR
Round 2 · Interface
I mapped how a doctor uses the EHR through a typical consultation. Each phase showed me where the record slows people down, and what the design could do about it.
Patient examination
Talks to the patient, checks symptoms, examines.
PainTime constraints. Capturing everything.OpportunitySimpler data entry, input on mobile.
Diagnosis & treatment plan
Reviews data and results, diagnoses, plans.
PainData overload. Hard to interpret.OpportunityBetter data visualisation.
PainGetting orders right. Input errors.OpportunitySimpler ordering, data validation.
Patient follow-up
Reviews results, adjusts the plan, documents progress.
PainFinding the patient. Keeping up with changing data.OpportunityFind the profile faster, find and edit the right data.
Two opportunities stood out because they appear at both ends of the day: finding the right patient and capturing information without the typing. They became the two pillars of the design.
The doctor's journey, with feelings from frustrated to happy.The nurse's shift: receiving patients, examinations, medication, monitoring, handover.
05Structure first
Before drawing screens, I placed the patient search inside the whole product, so it wouldn't be designed in a vacuum.
Not Ill Co. EHR
Dashboard
Critical notifications
Patient alerts
Recent activity
Patient management
Patient search
Patient list
Patient dashboard
Registration
Appointments
Check-in
Clinical information
Clinical notes
Prescriptions
Lab orders
Test results
Vital signs
Communication
Messages
Specialist consultation
Patient updates
Treatment plans
Active plans
Treatment history
Resources
Medical research
Training materials
Settings
User profile
User roles
Notifications
Security
In scope for this challengeOn mobile the main navigation becomes four tabs: Dashboard, Patients, Calendar, Messages.
The patient dashboard, ordered by urgency
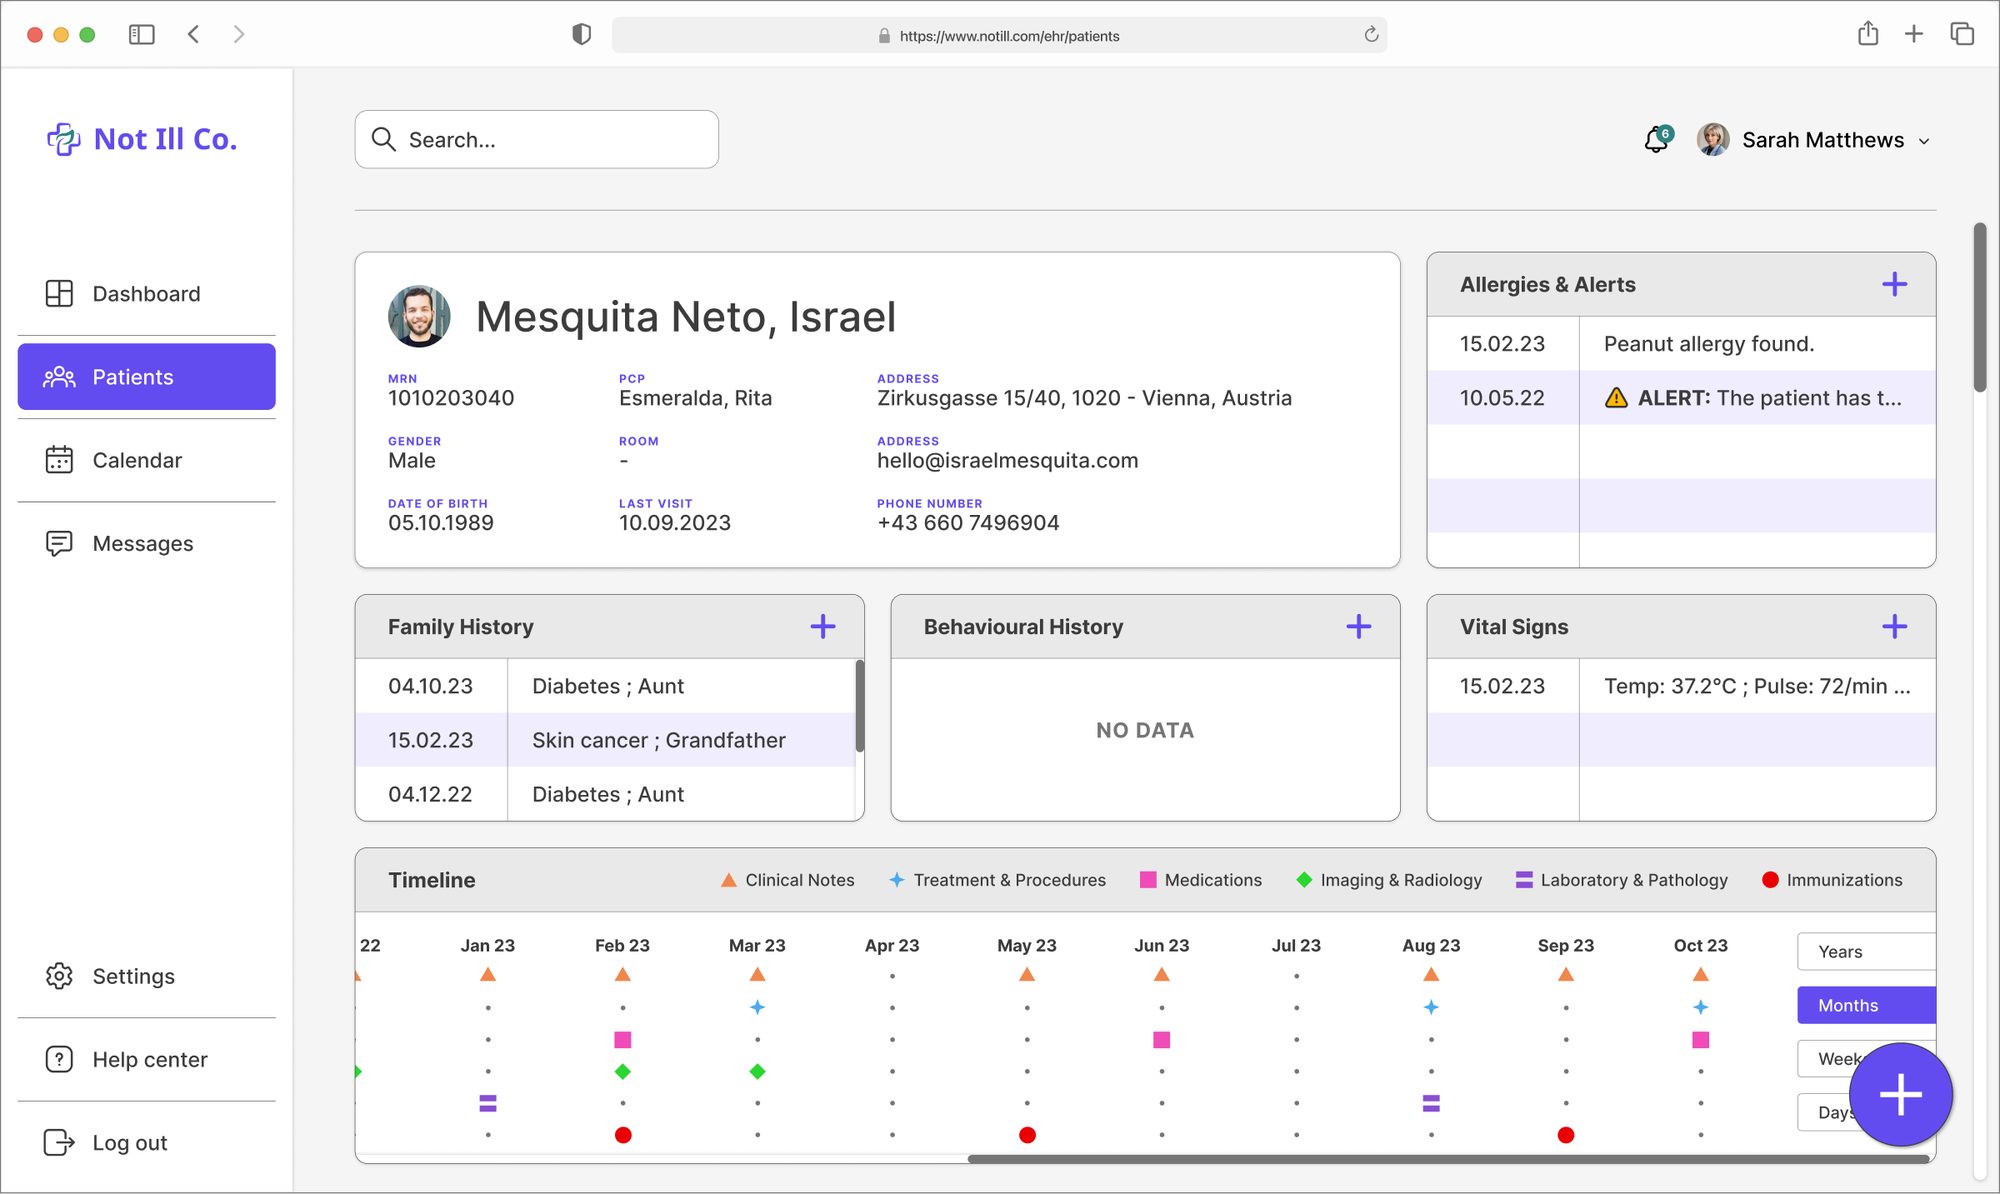
A patient record holds a lot: demographics, a history timeline, vitals, allergies and alerts, family and social history, consultations, imaging, medications, immunizations, lab results, notes and treatments. I sorted it into three levels, from what you need in the first second to what you do last.
First glance
Urgent context
Demographics, vital signs, allergies and alerts, family and behavioural history.
Then
Timeline and treatments
History timeline, clinical notes, treatments, medications, consultations, imaging, lab, immunizations.
Always at hand
Action to add
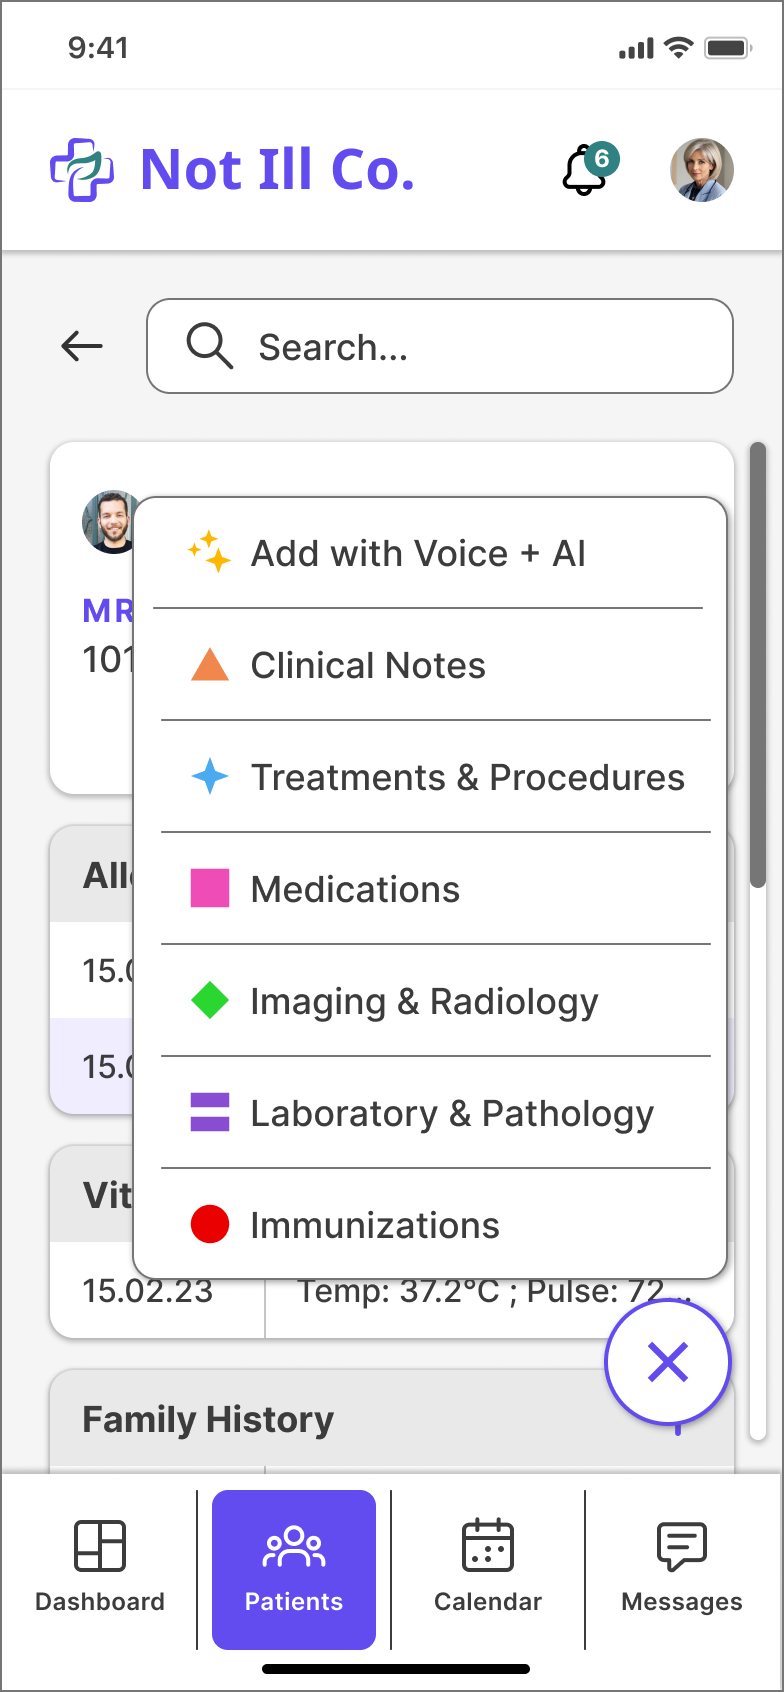
Add to any section from its own table, or from one button, including Add with Voice + AI.
The dashboard in three blocks.Everything a patient record has to hold.
06From sketch to screen
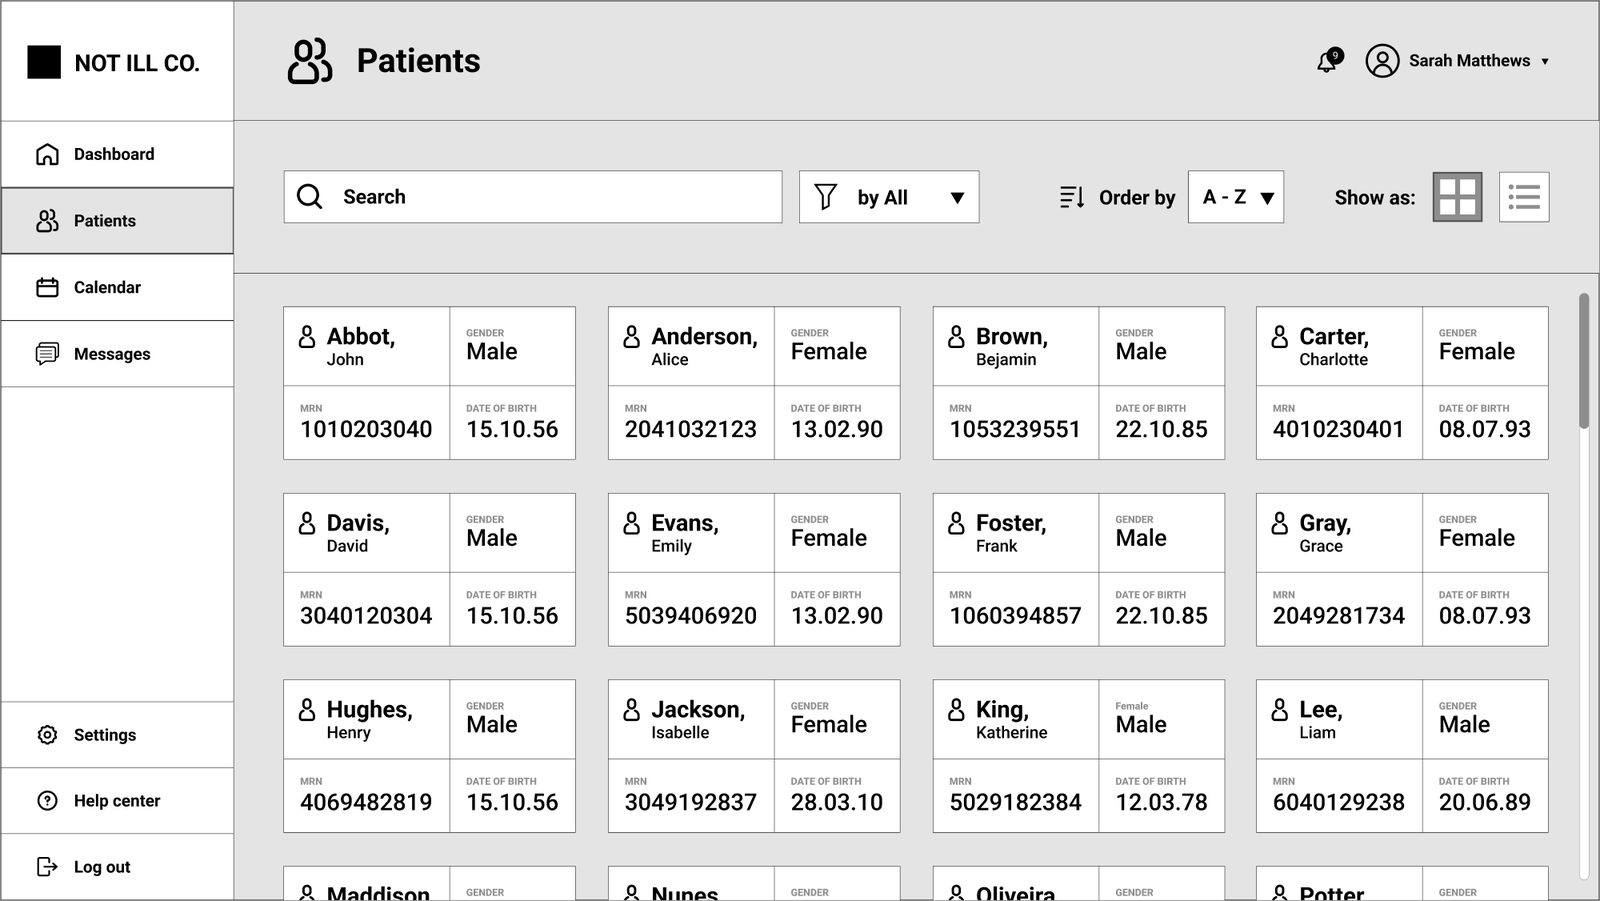
I sketched on paper first, to try ideas fast and throw most of them away, then moved the survivors to wireframes and hi-fi.
Patient list.Filtering, version 1 and 2.Patient dashboard.
Drag the handle. The structure stayed, the hierarchy got clearer.
07Finding a patient
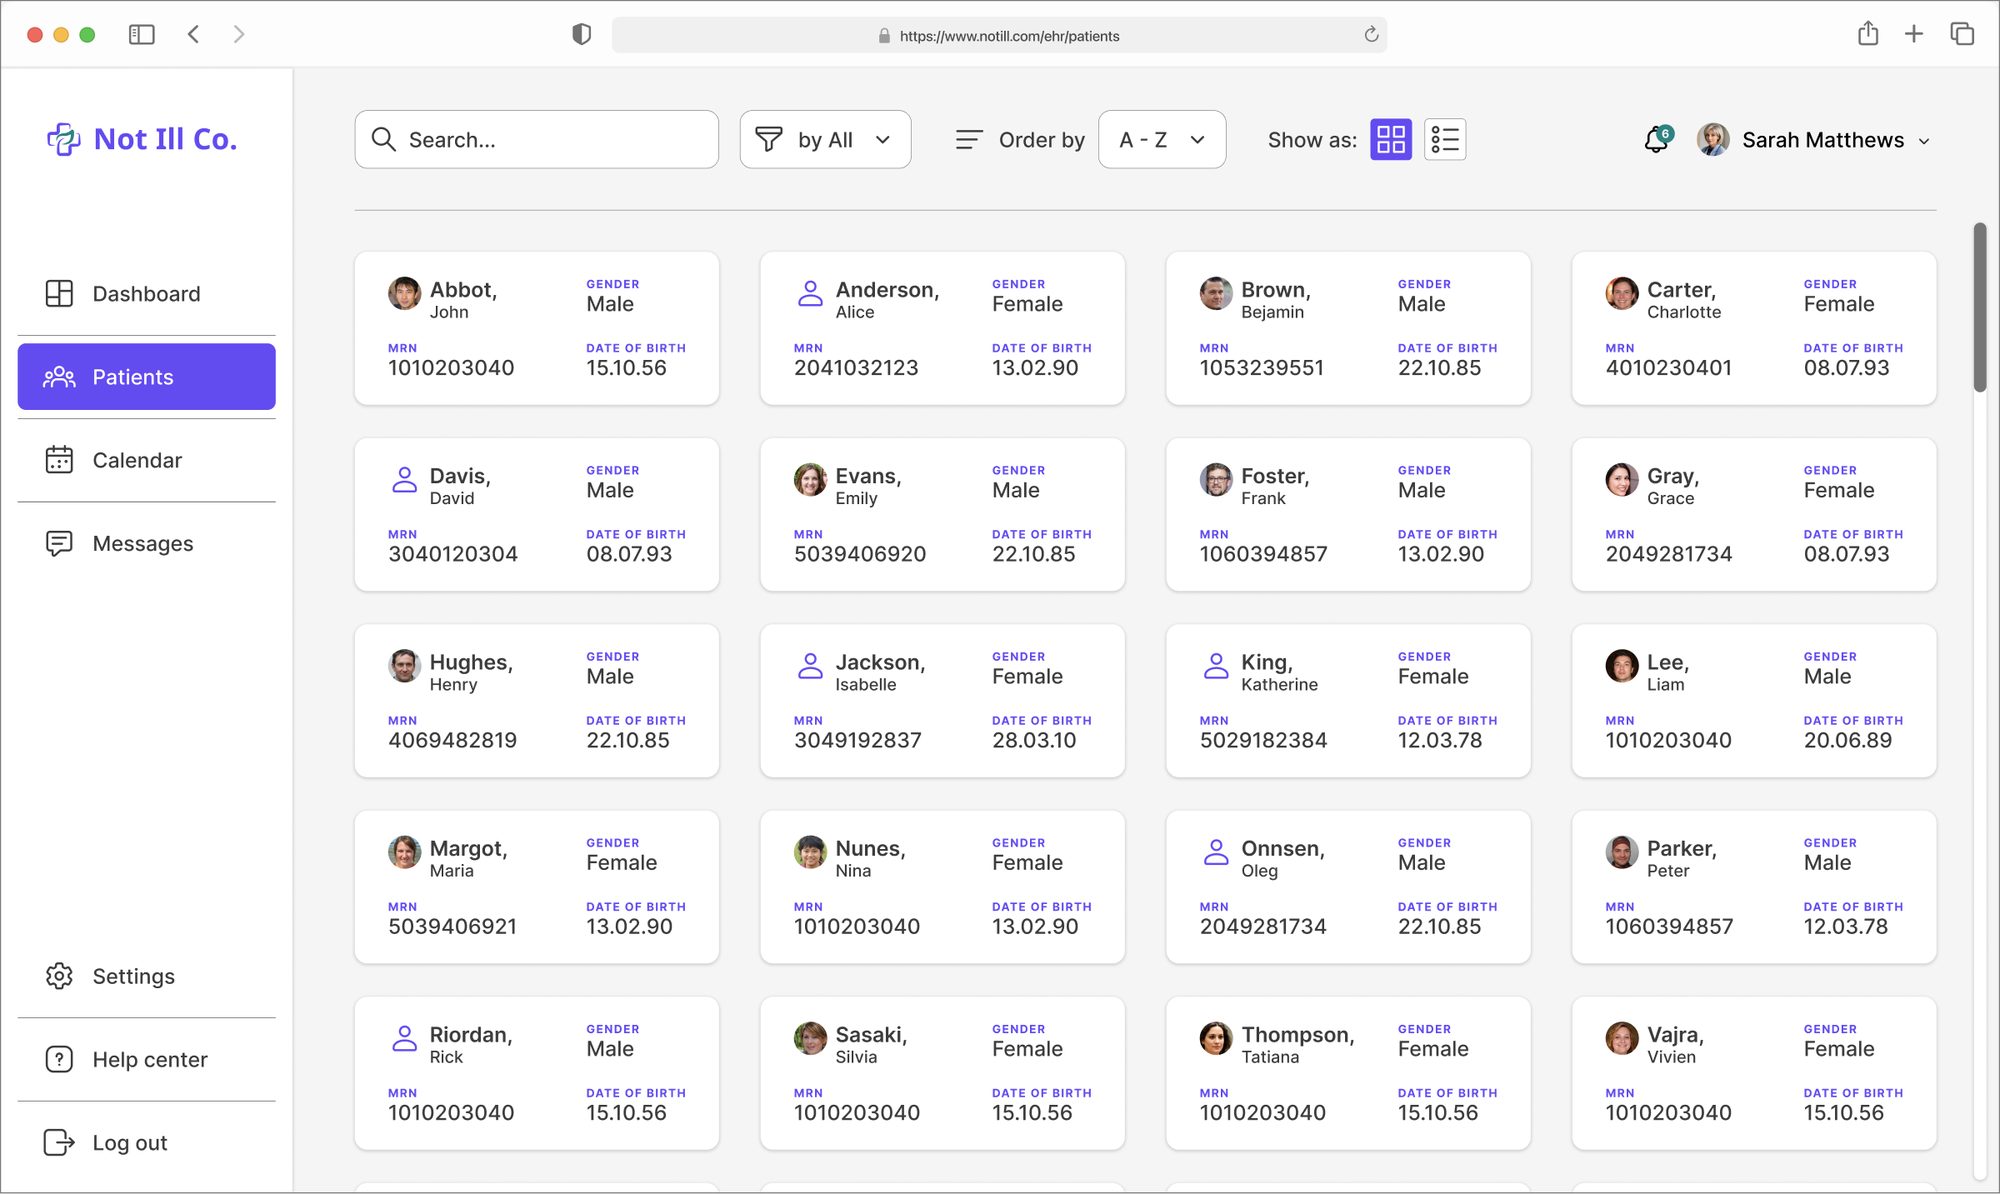
Three decisions shaped the patient list, the screen clinicians open many times a day.
Decision 1
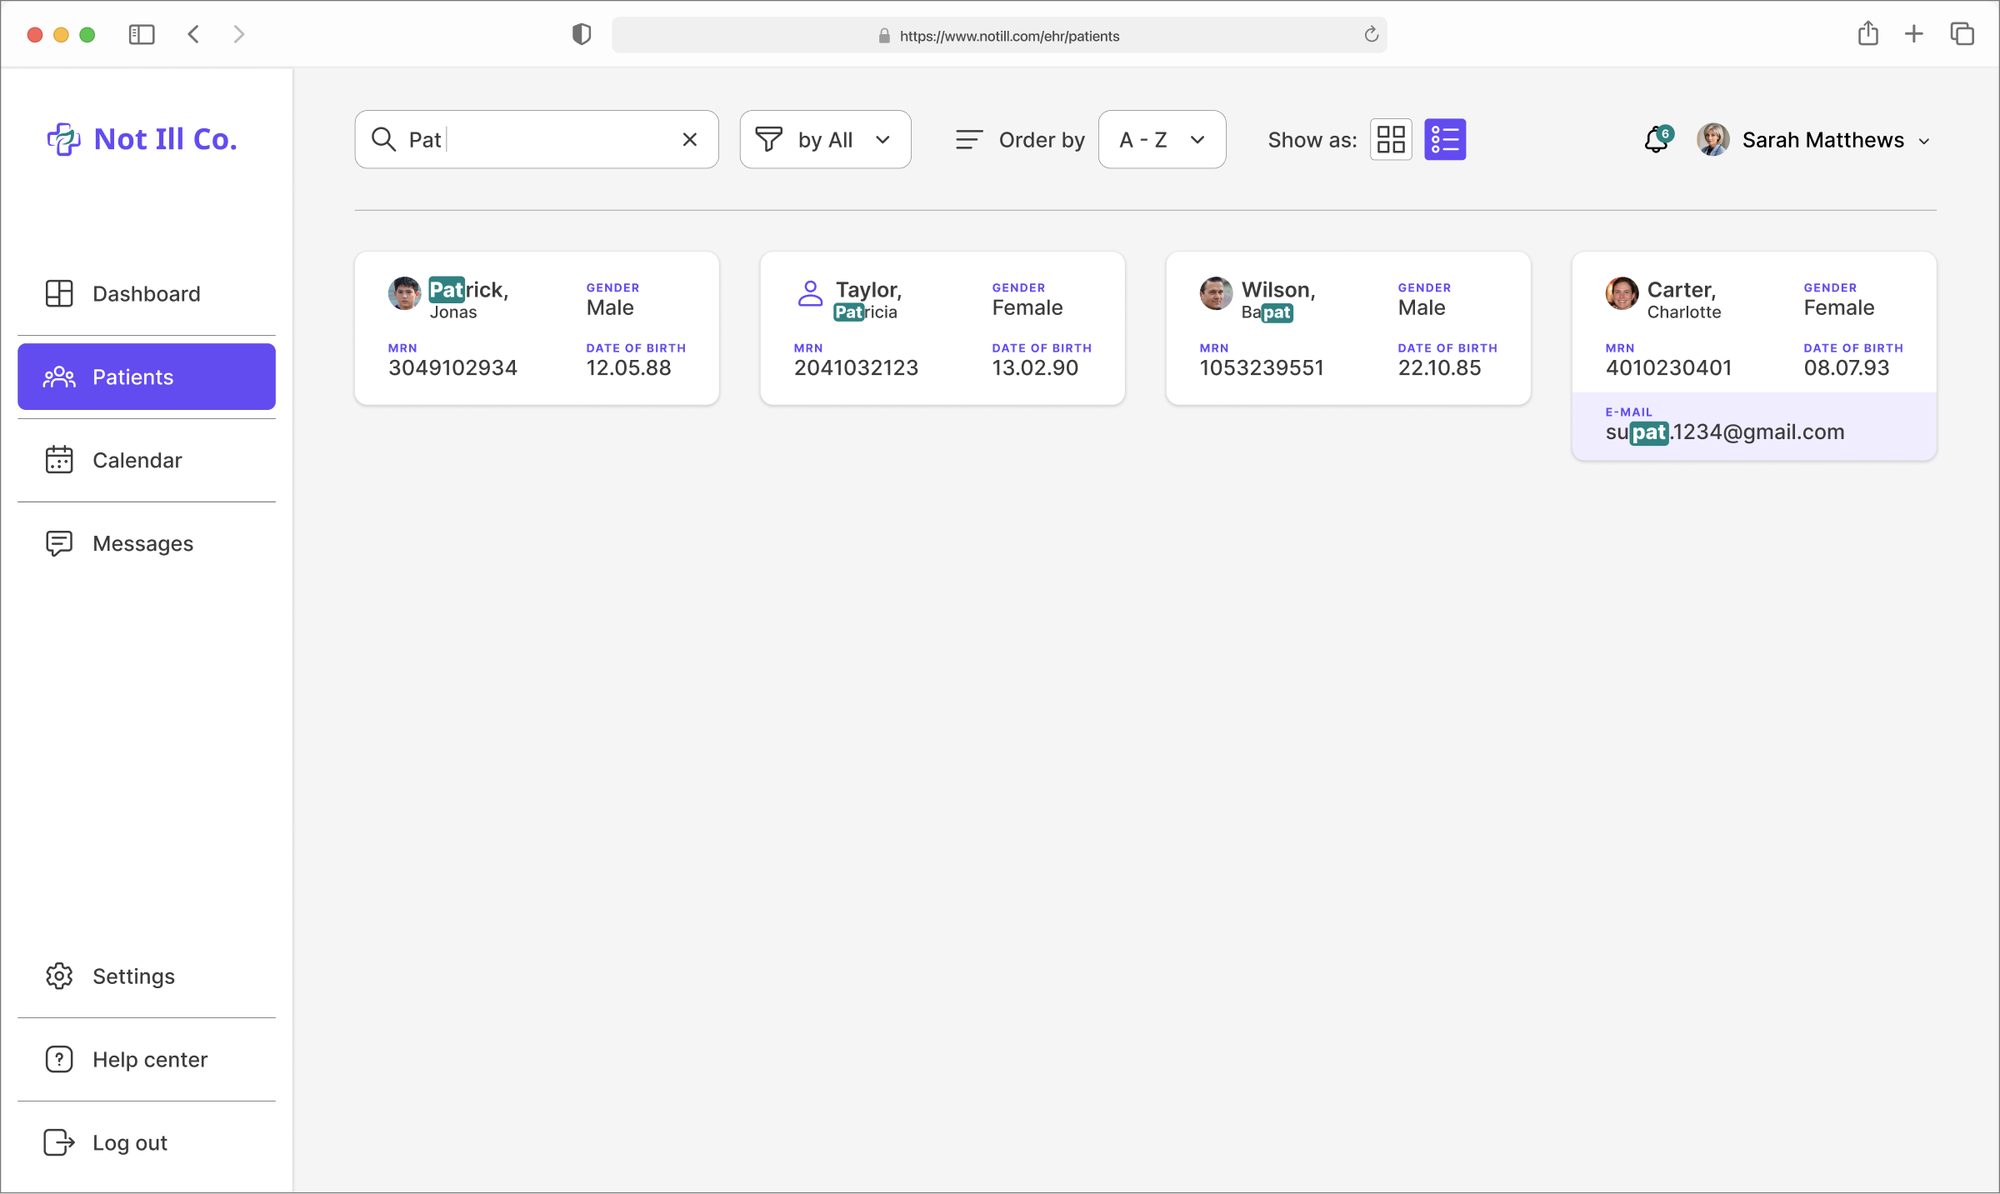
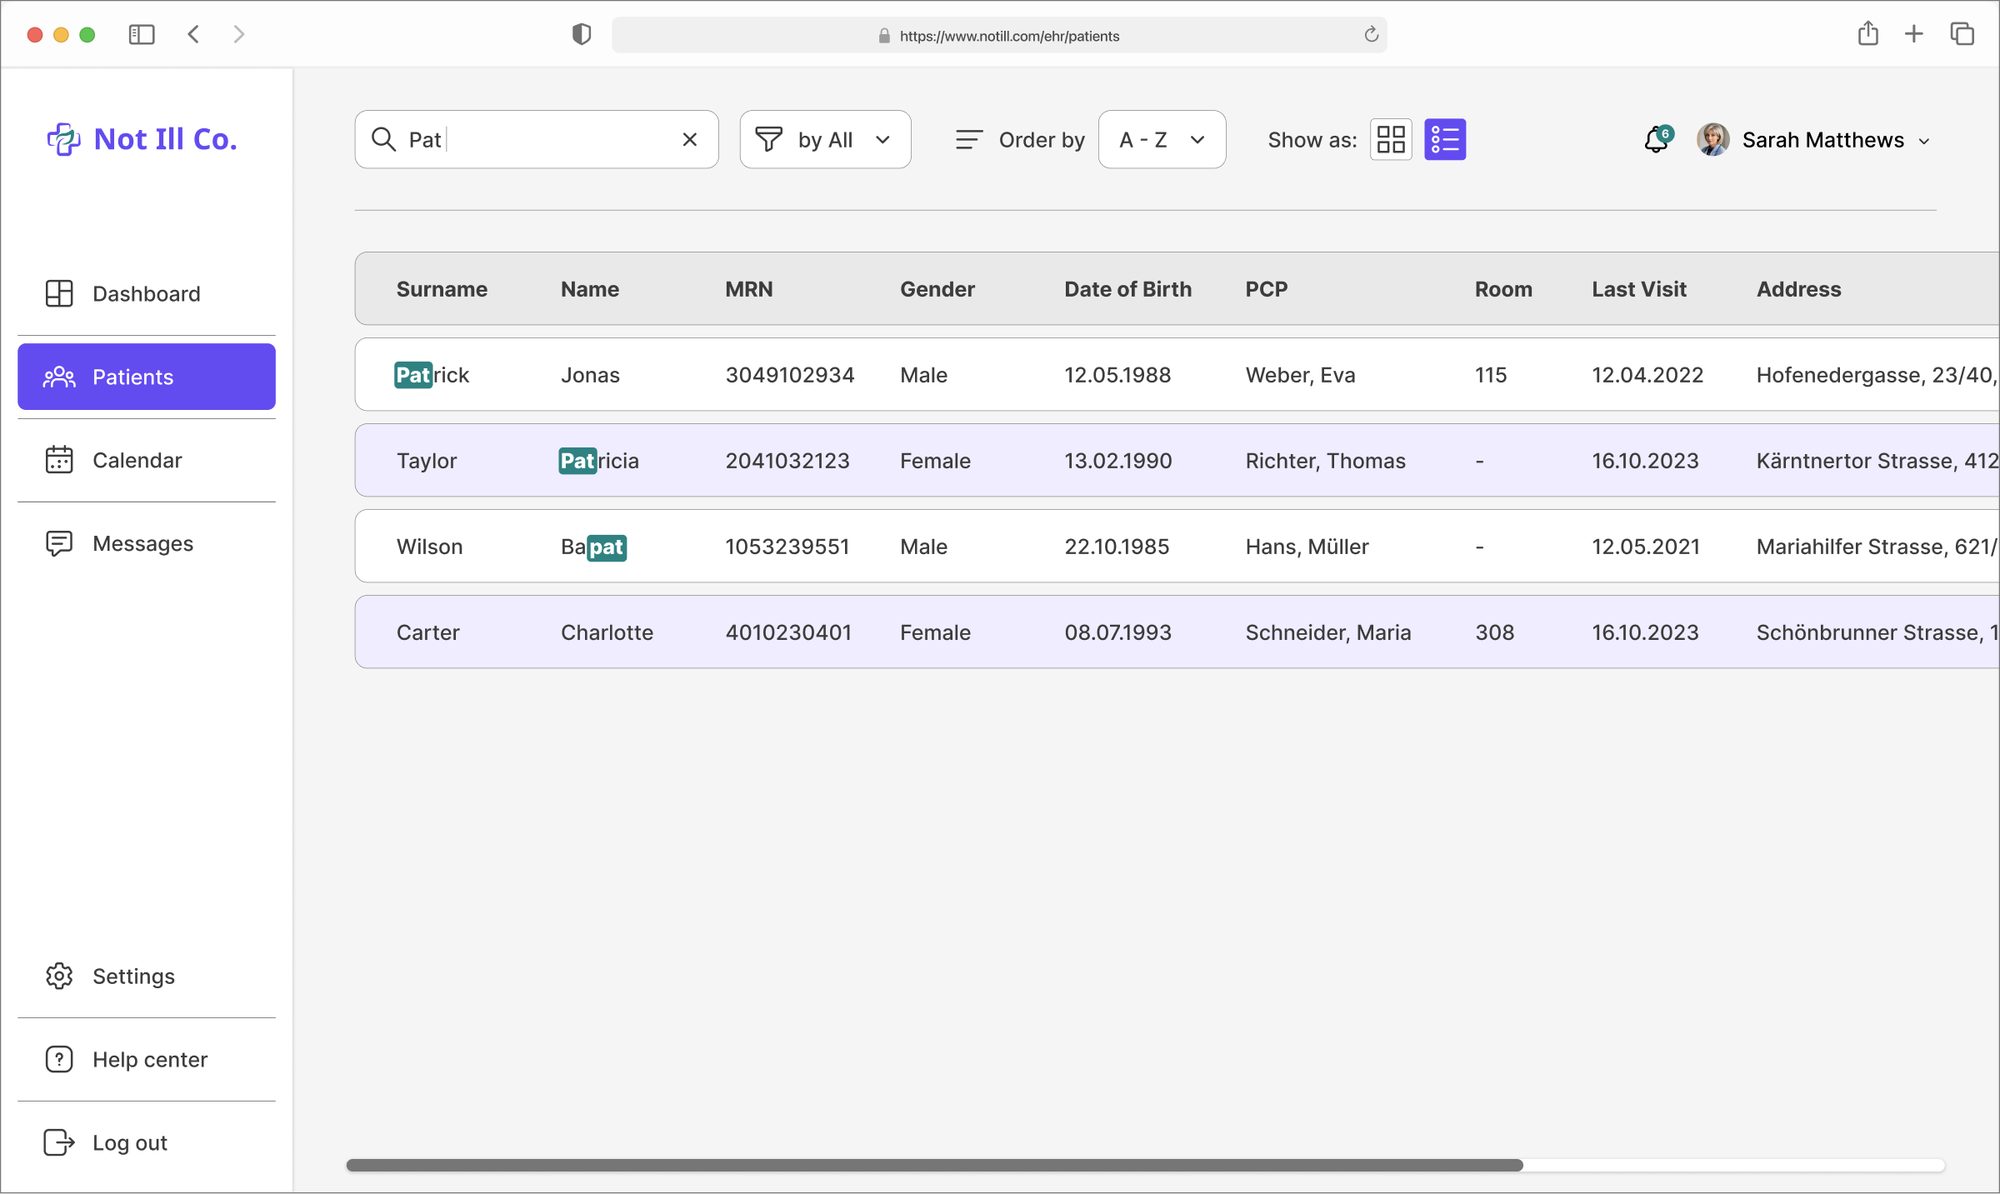
Search that shows why a result matched
What I saw
With a thousand patients and many similar names, a list of results isn't enough. You need to see at a glance which one is right.
What I changed
Results appear as you type.
The matching letters are highlighted.
Every result shows MRN and date of birth, the two values that tell people apart.
Why
Picking the wrong patient is a safety problem, not just a usability one. Making the match visible helps people confirm before they click.
Decision 2
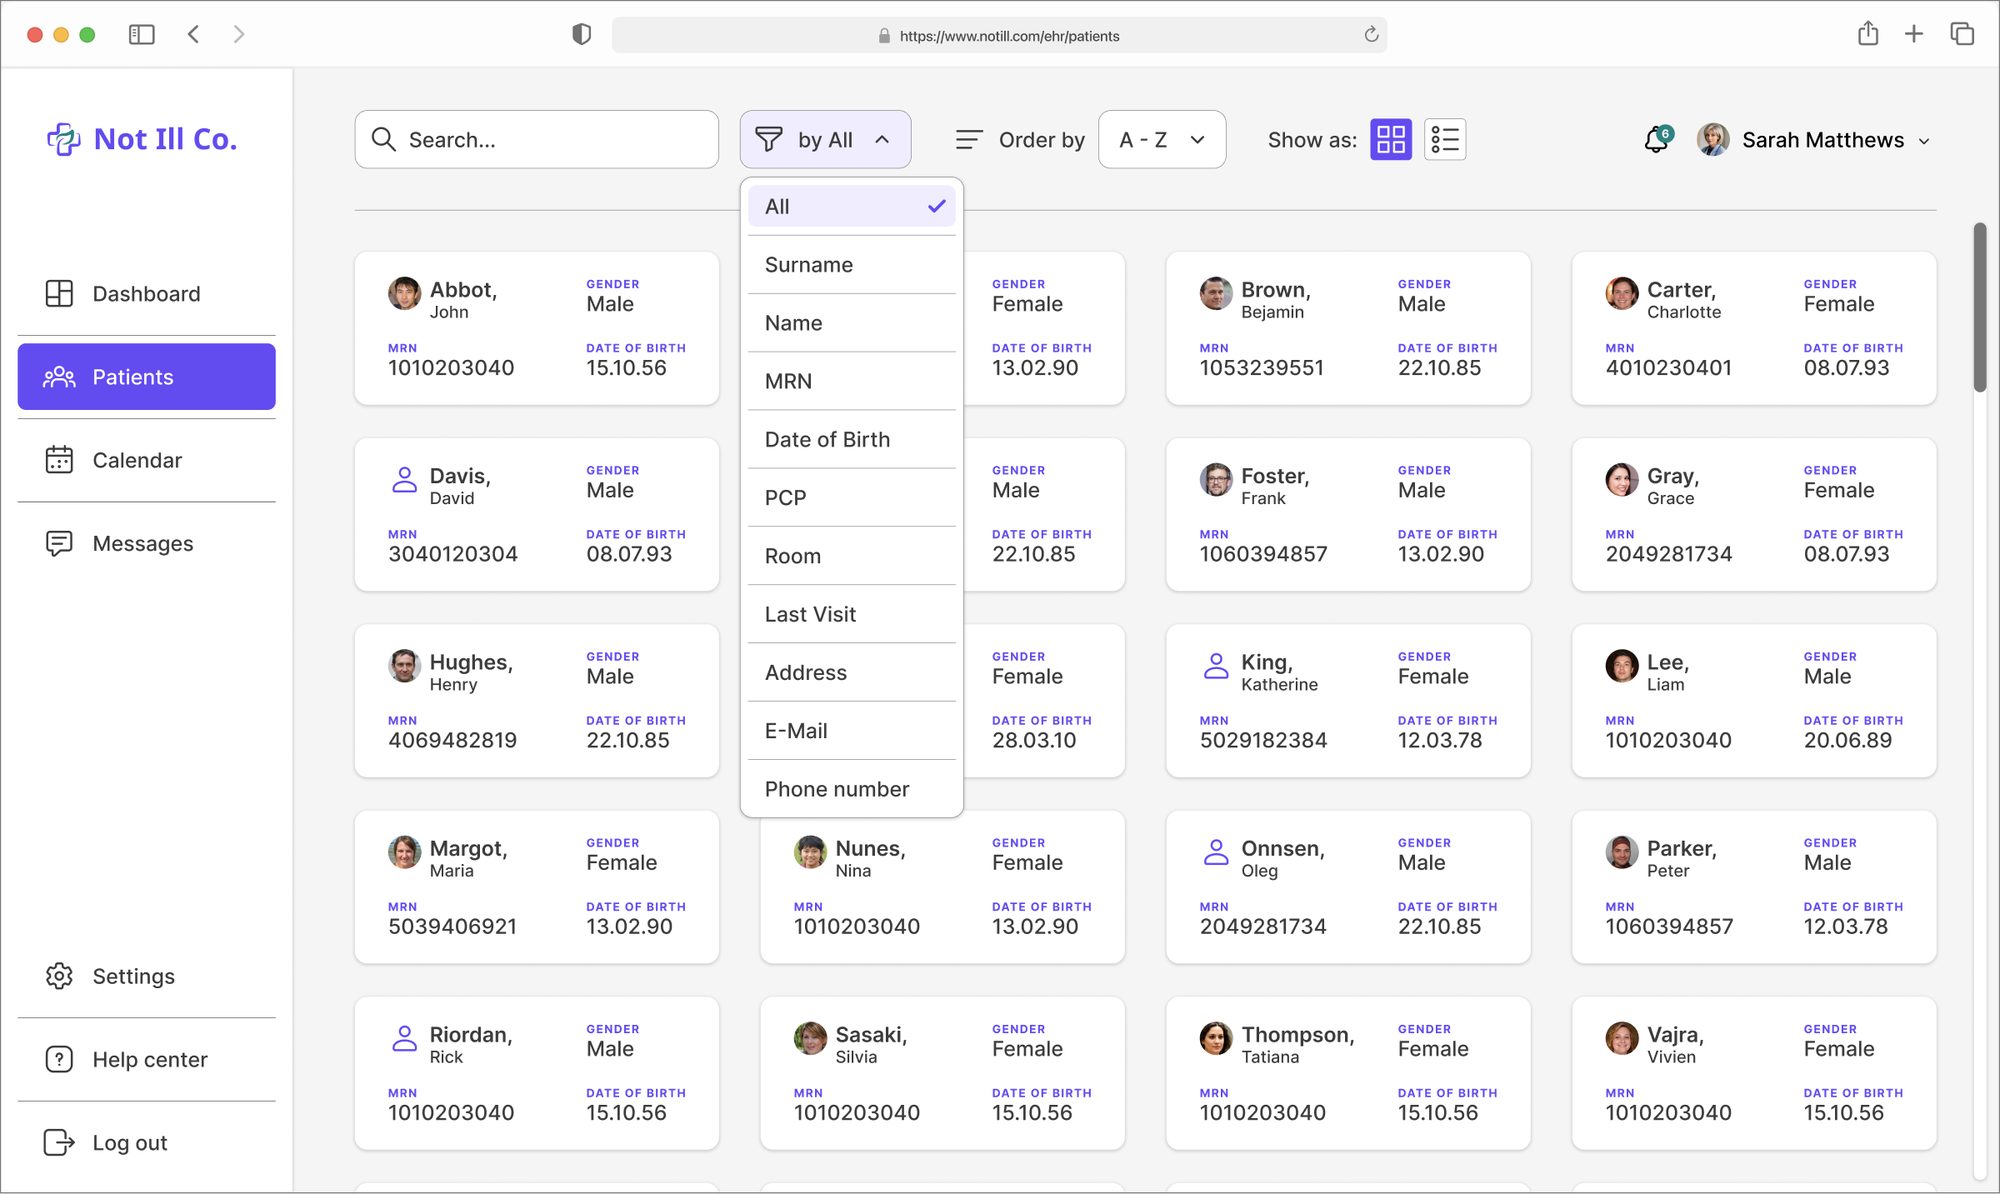
One filter at a time
What I saw
My first sketch was an advanced search with conditions you could stack. Powerful, but it looked like a database tool, the kind of interface my research said people avoid.
What I changed
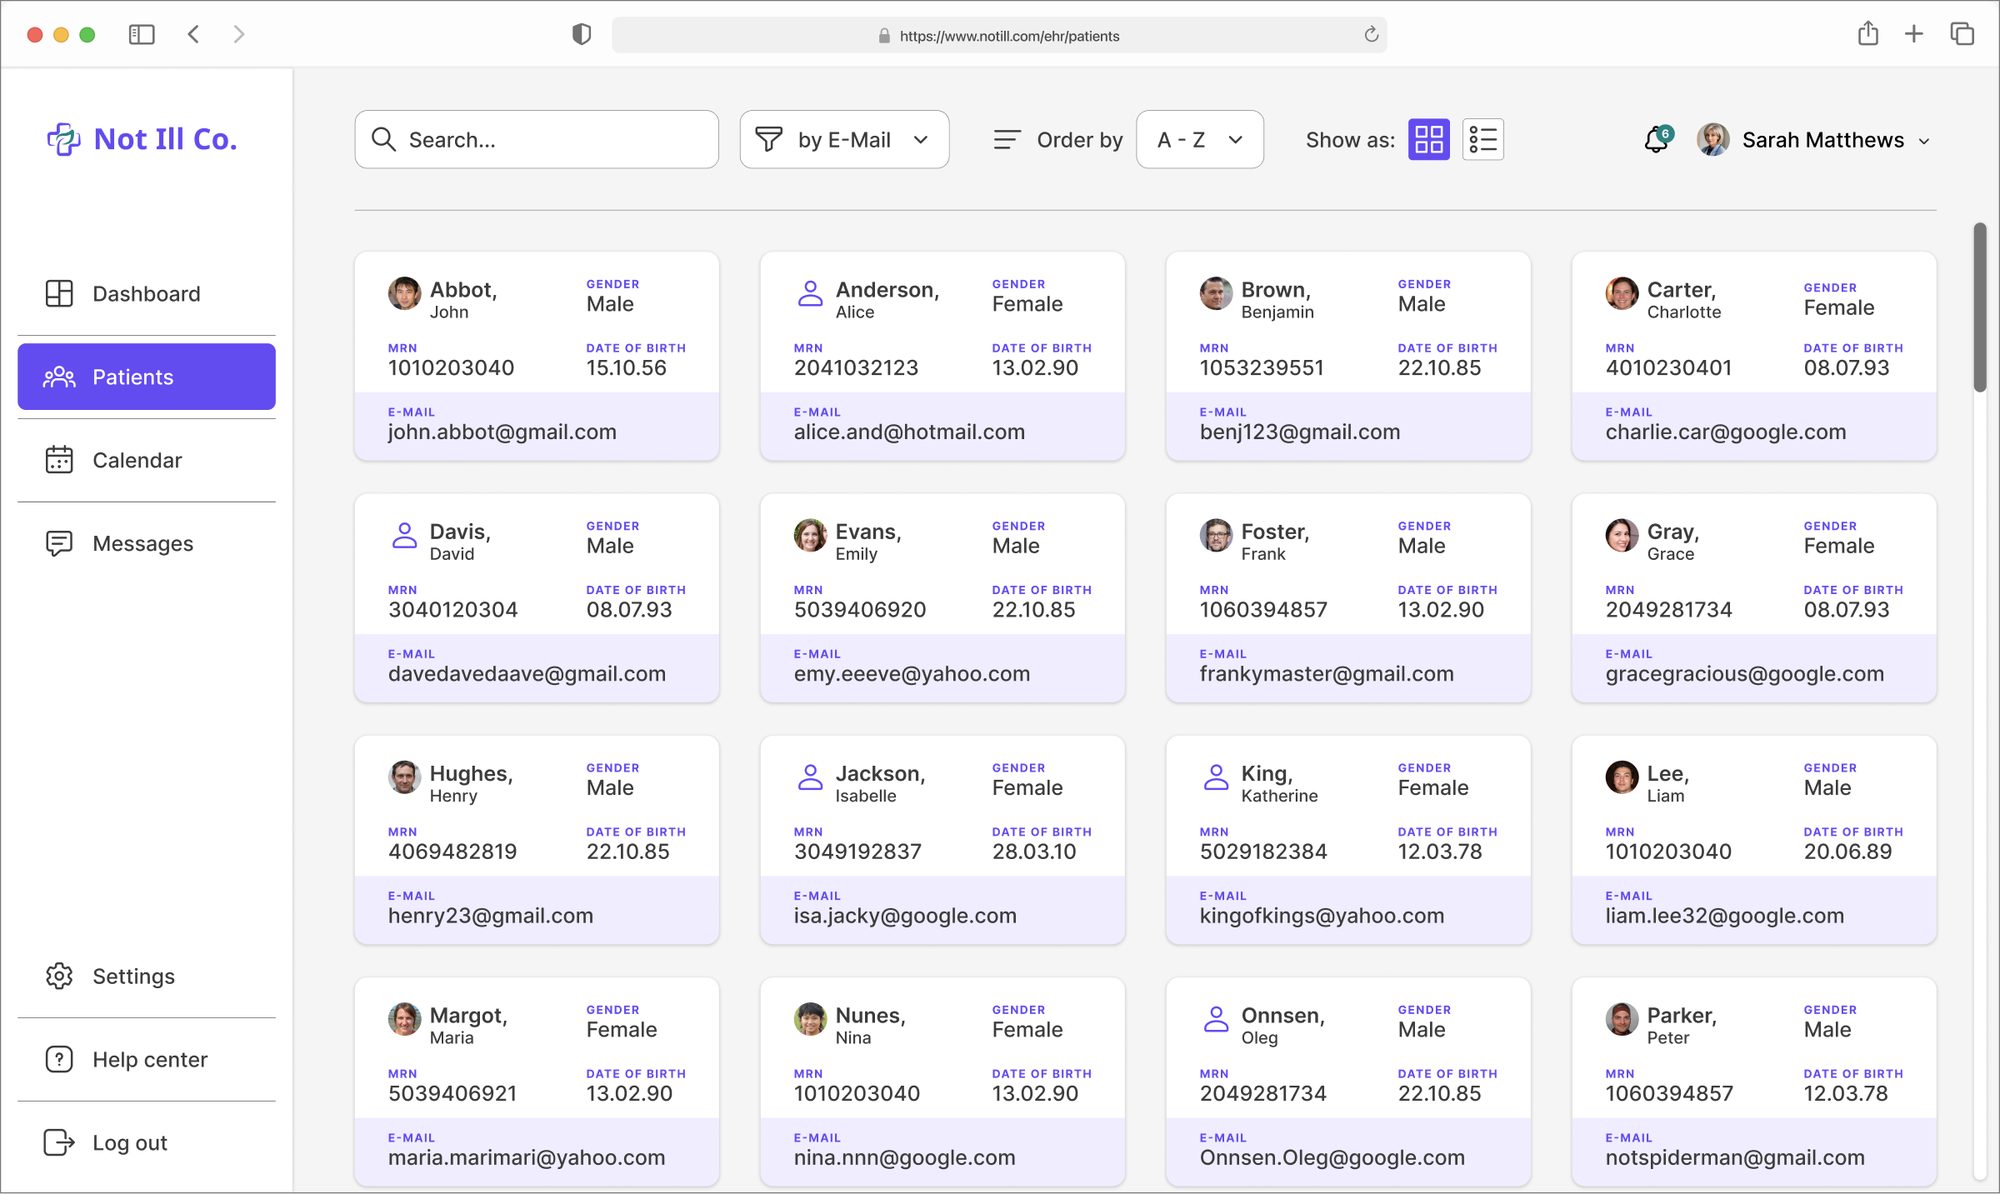
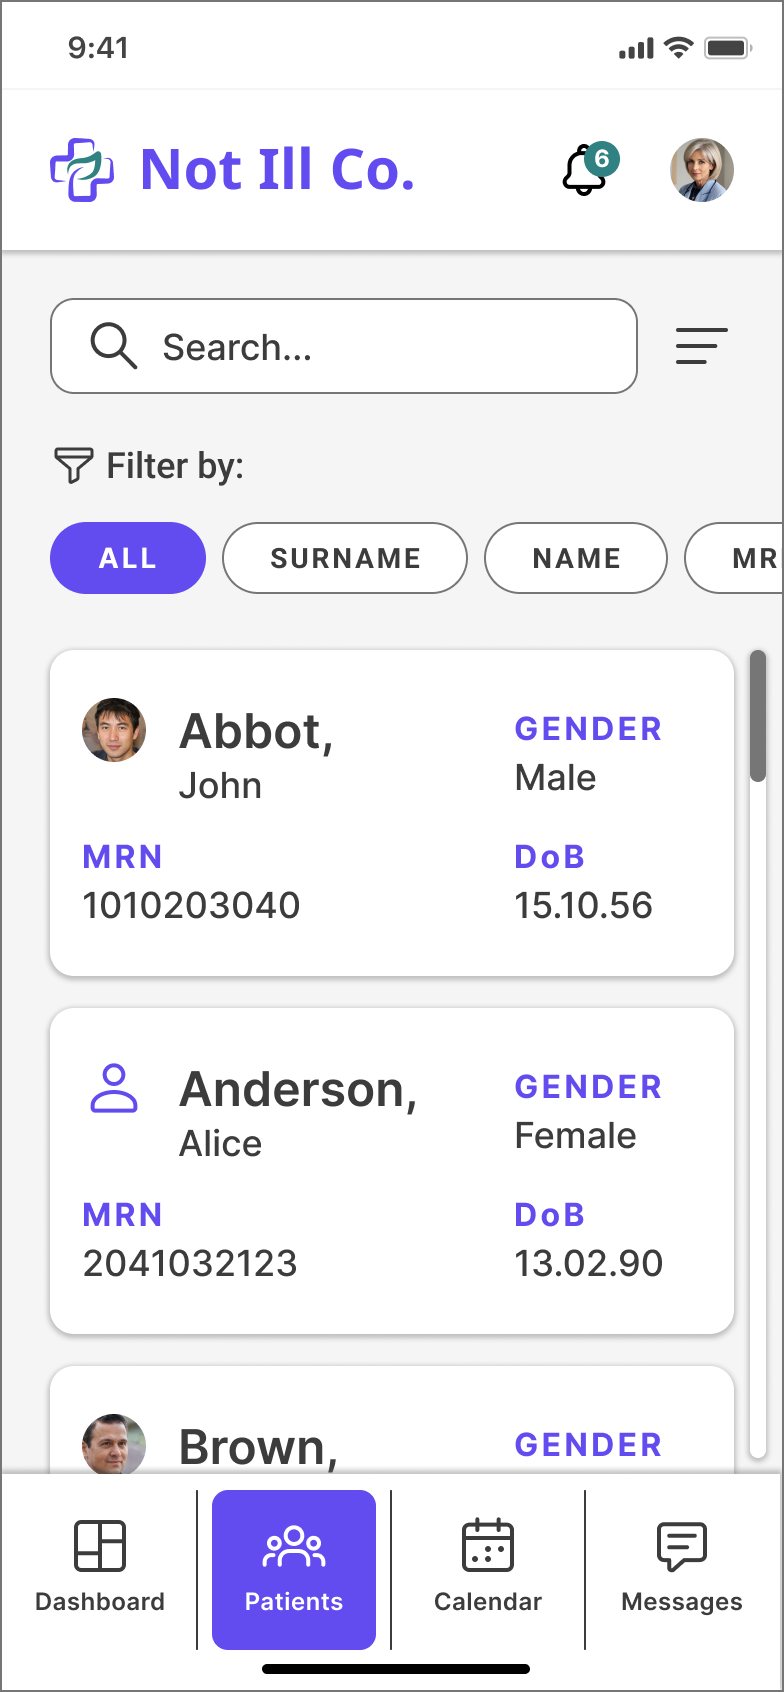
Version 2: one row of chips, All, Surname, Name, MRN, DoB, PCP, E-mail and more.
One filter per search.
Filtering by a field adds that field to the card, so you see what you searched for.
Why
Most searches start with one thing you know: a name, a number, a date. One chip is enough, and it needs no training.
Trade-off: combining criteria takes two searches. I'd validate with clinicians how often that's needed.
Decision 3
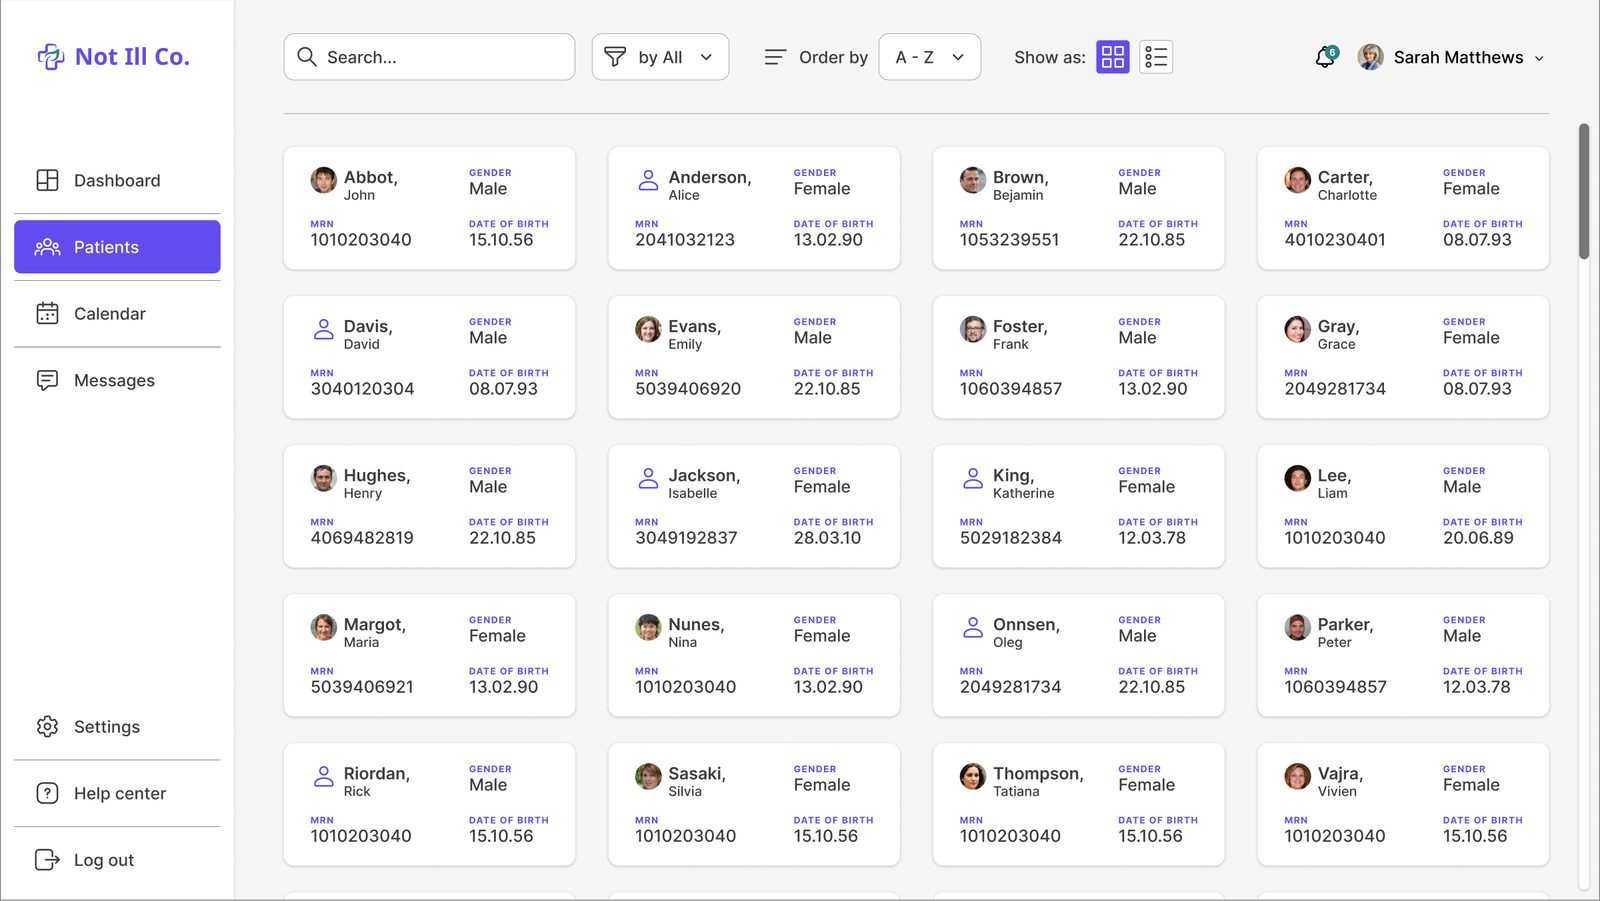
Cards by default, a table when you need it
What I saw
The reviewers found search results in a table a bit odd. But a table compares many patients at once.
What I changed
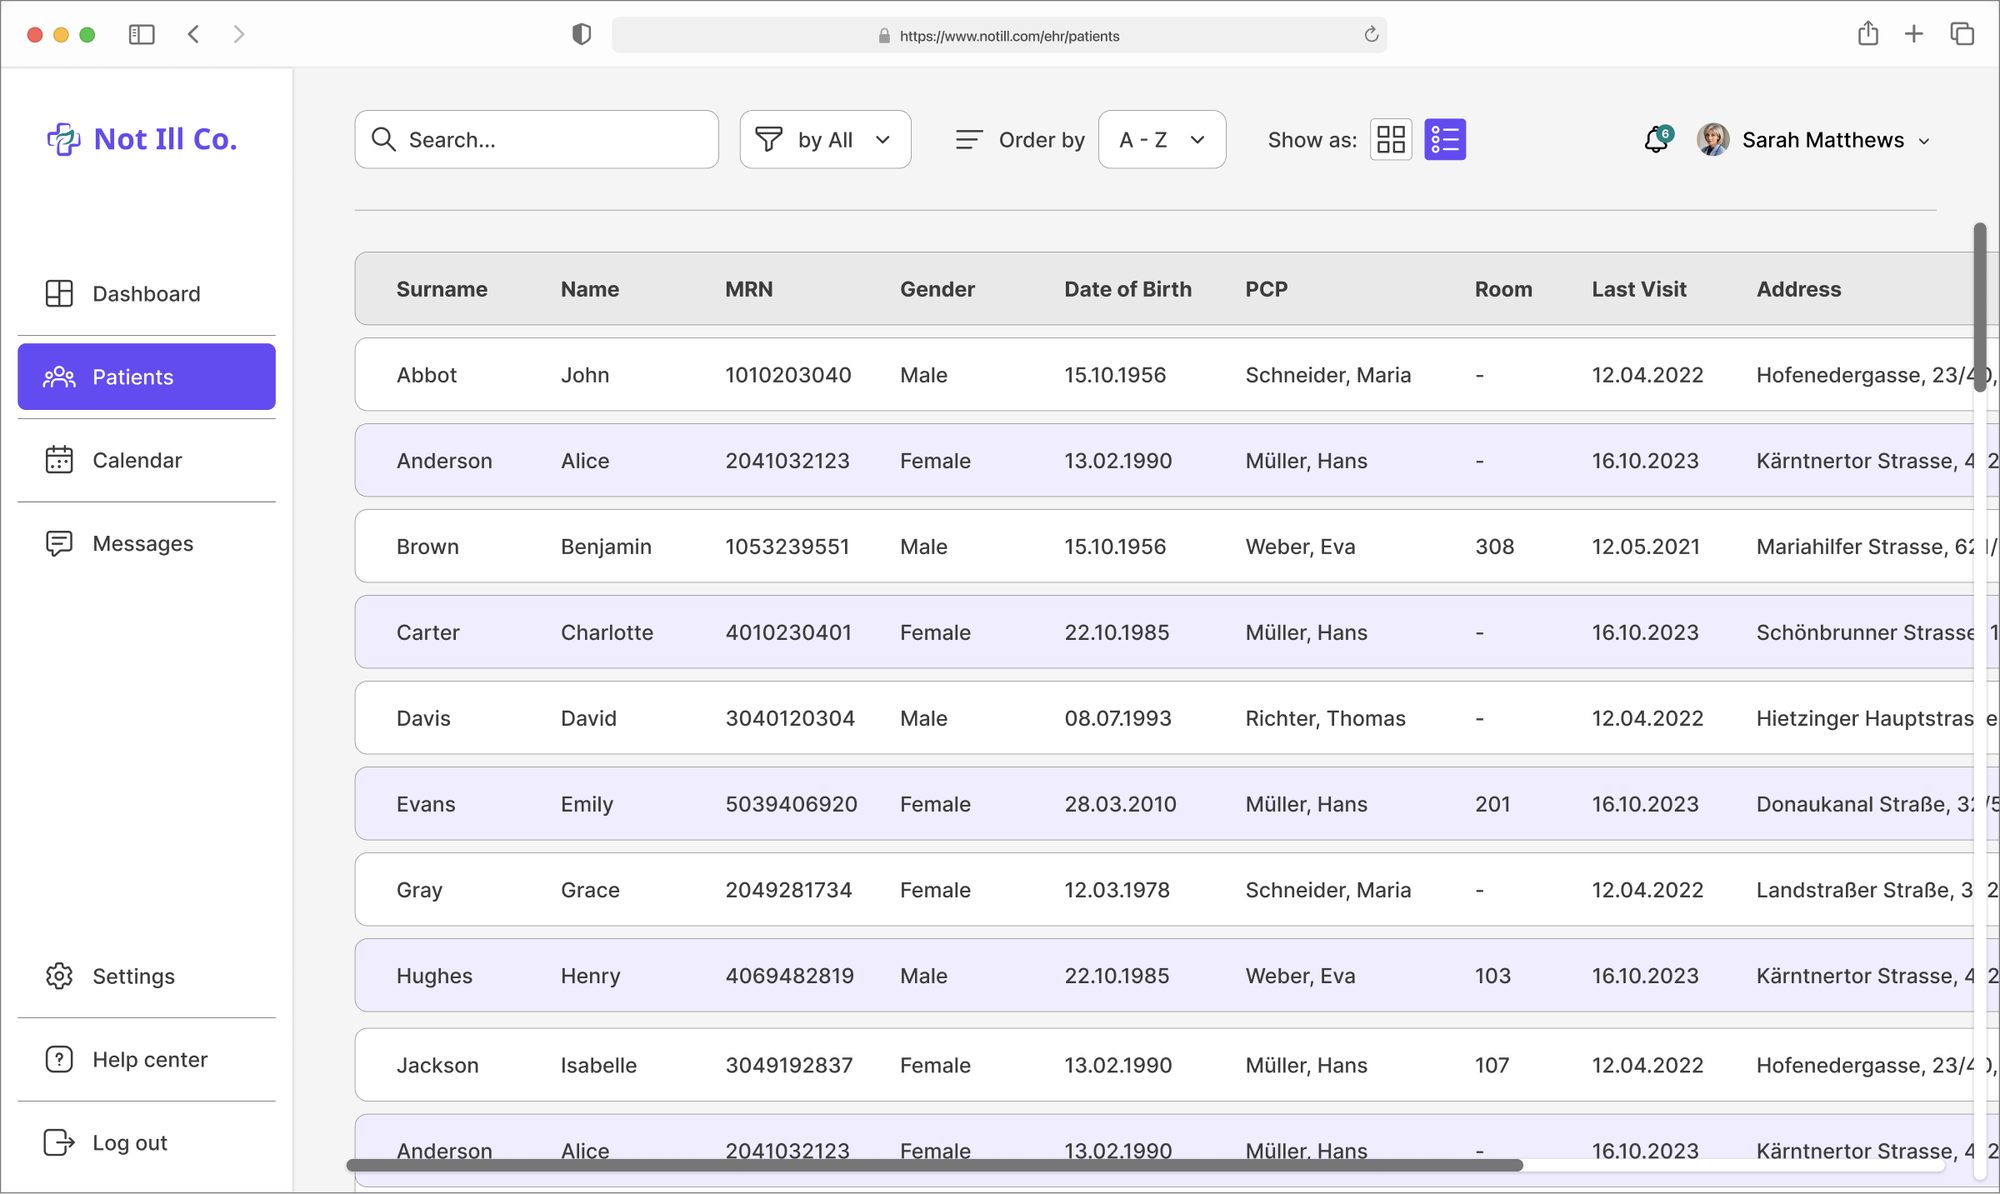
Cards by default on desktop, a table one toggle away.
Cards only on mobile, where a table doesn't fit.
Why
Two views for two jobs: cards to recognise one person, a table to scan many.
Explore the desktop list
Six states of the patient list. Pick one, or let it play.
1
What a nurse told me later
Cards
Easy to read, easy to tell people apartWork the same on desktop and mobileFewer patients on screen
Table
Many patients and columns at onceFamiliar from other systemsDense, needs a big screen
After the challenge, I showed both views to a nurse: “The cards are beautiful, but the table seems more useful.” For her daily work, density won. I'd test which view should be the default with more clinicians.
08The patient dashboard
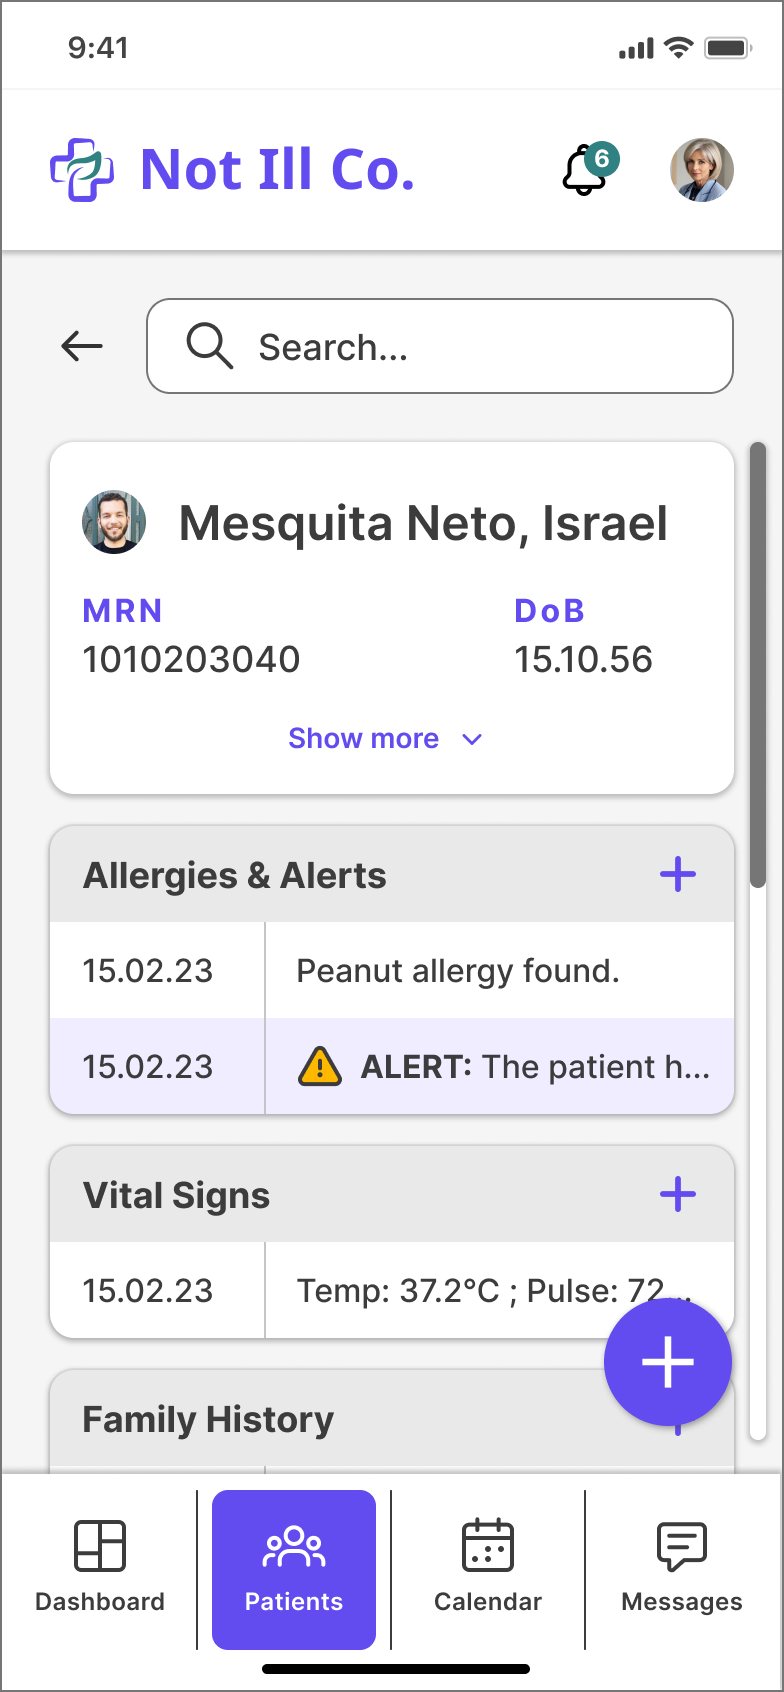
Once you find the patient, the dashboard follows the three levels: urgent context on top, the timeline and treatments below, and an add action everywhere.
Demographics, alerts and vitals first. Every table has its own + to add a row.
The add menu, with Voice + AI first.The full page.
09Mobile, and talking to the record
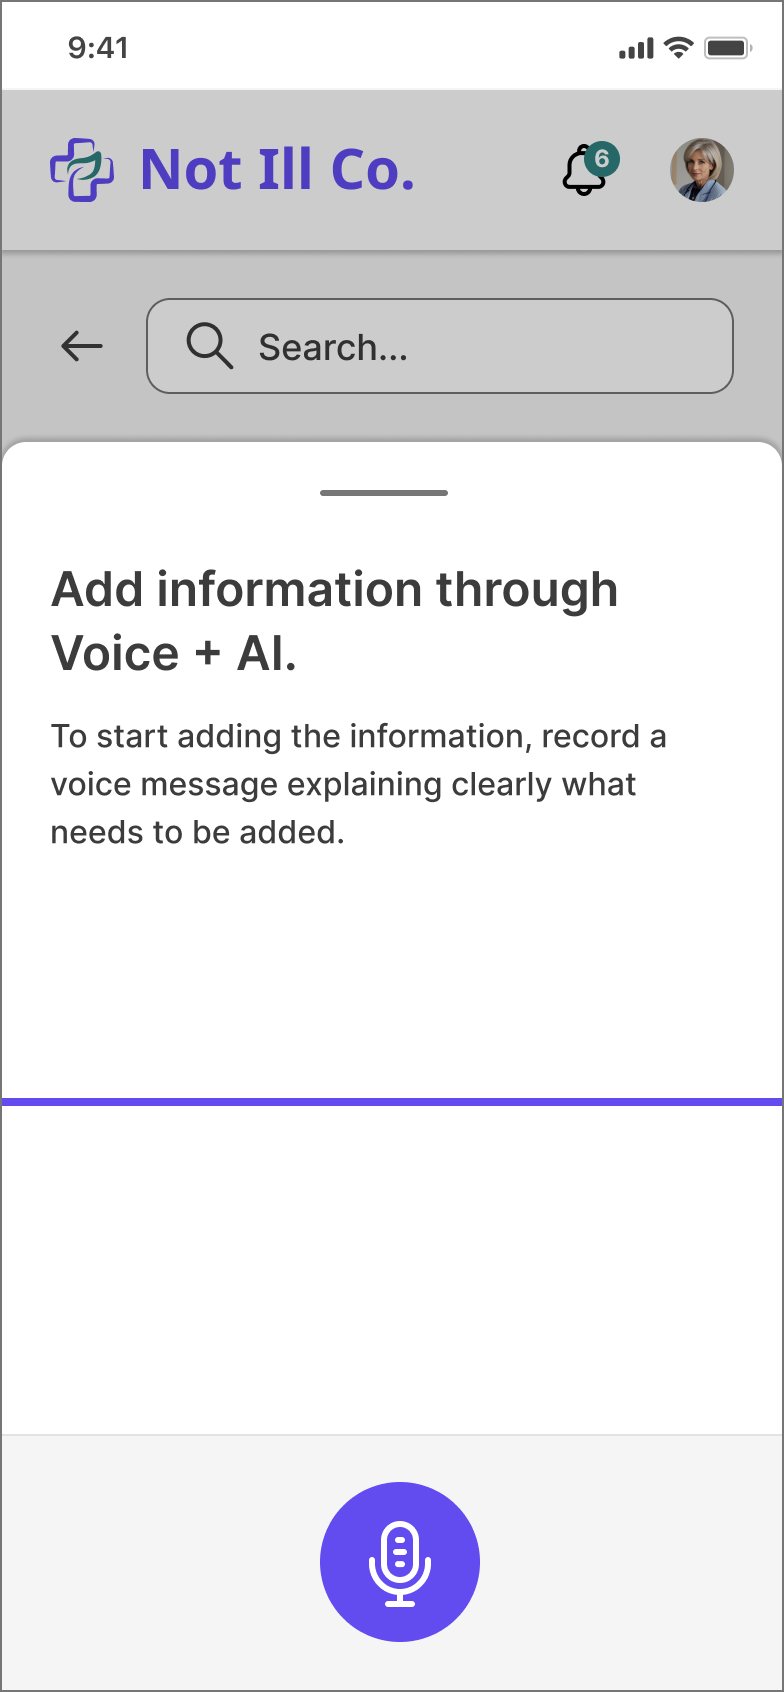
On a phone, typing a clinical note between rooms is exactly the workload the journey warned about. So the mobile flow lets clinicians say it instead.
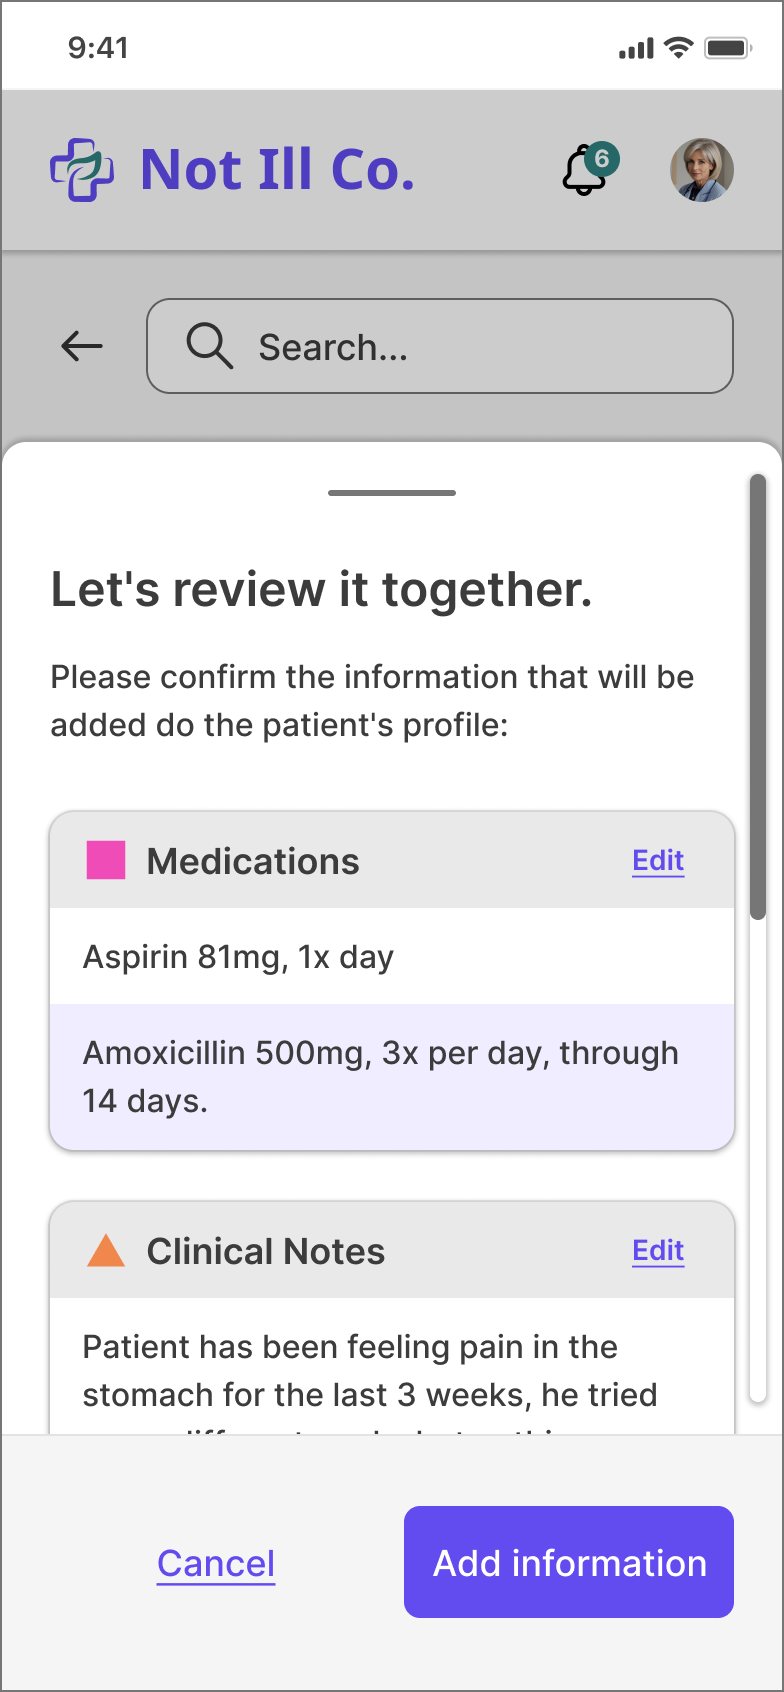
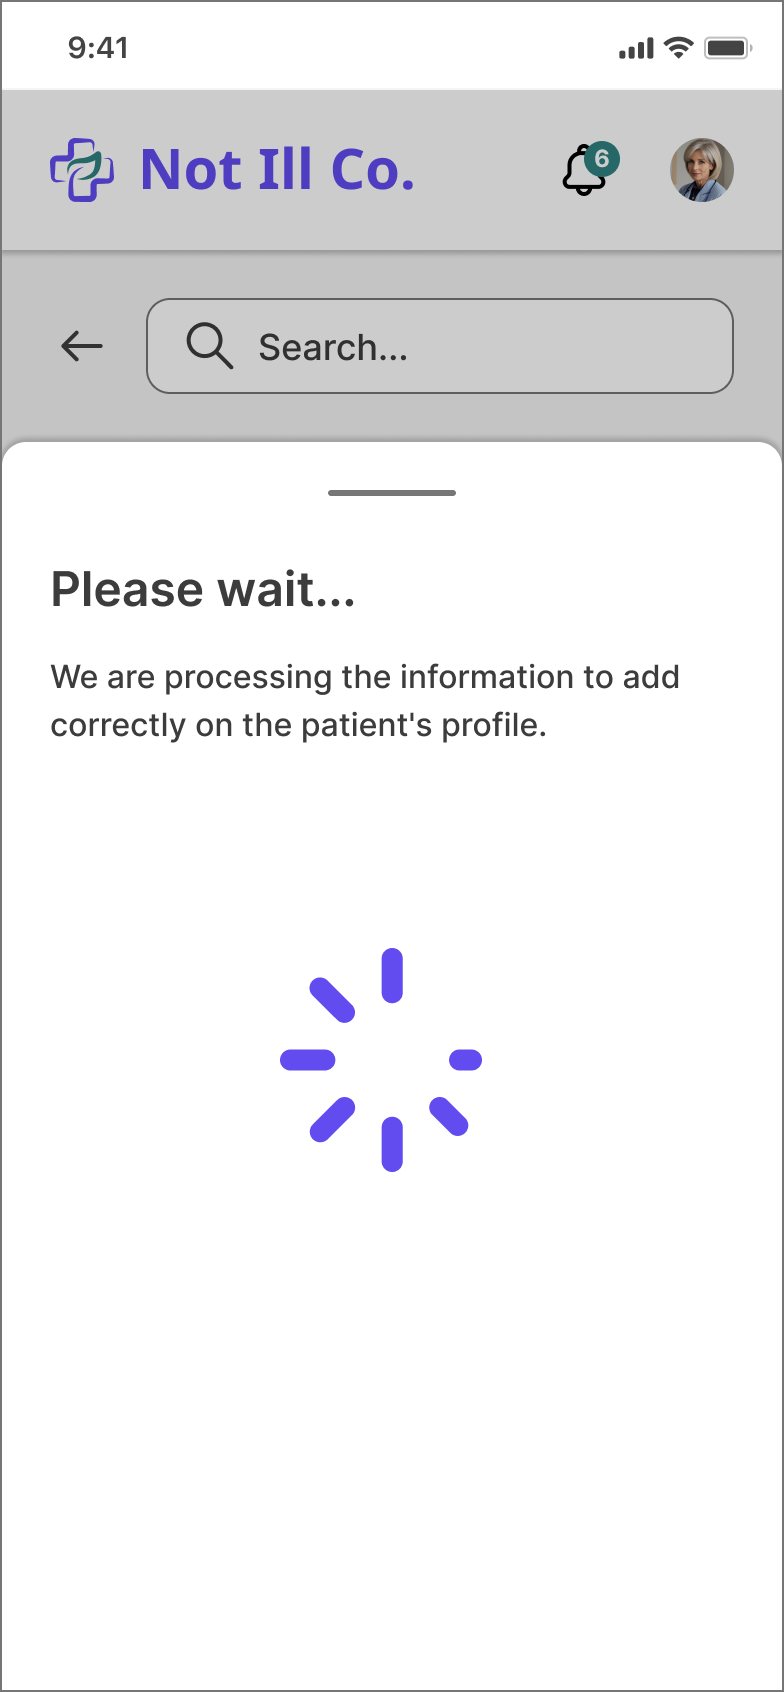
On mobile, the patient list stays hidden until you search, cards show five values, sections fold into accordions, and the add button floats over the page. The timeline stays on desktop.
Sketching the Voice + AI flow.
1SearchFind the patient with one filter.
2DashboardUrgent context first, then accordions.
3AddVoice + AI, or a section by hand.
4ExplainWhat to say, in one sentence.
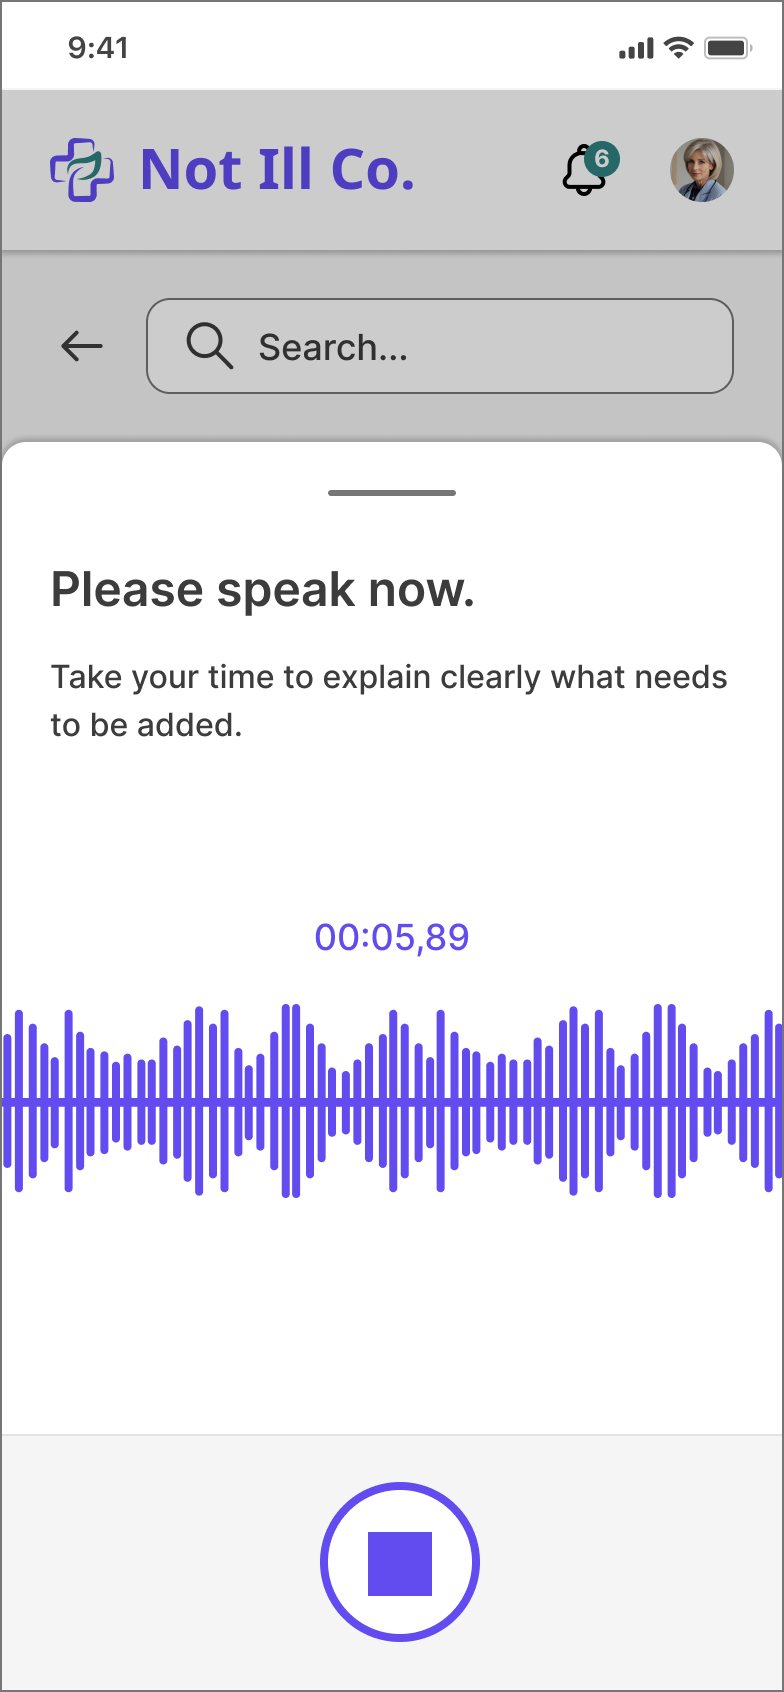
5RecordA timer and a live waveform.
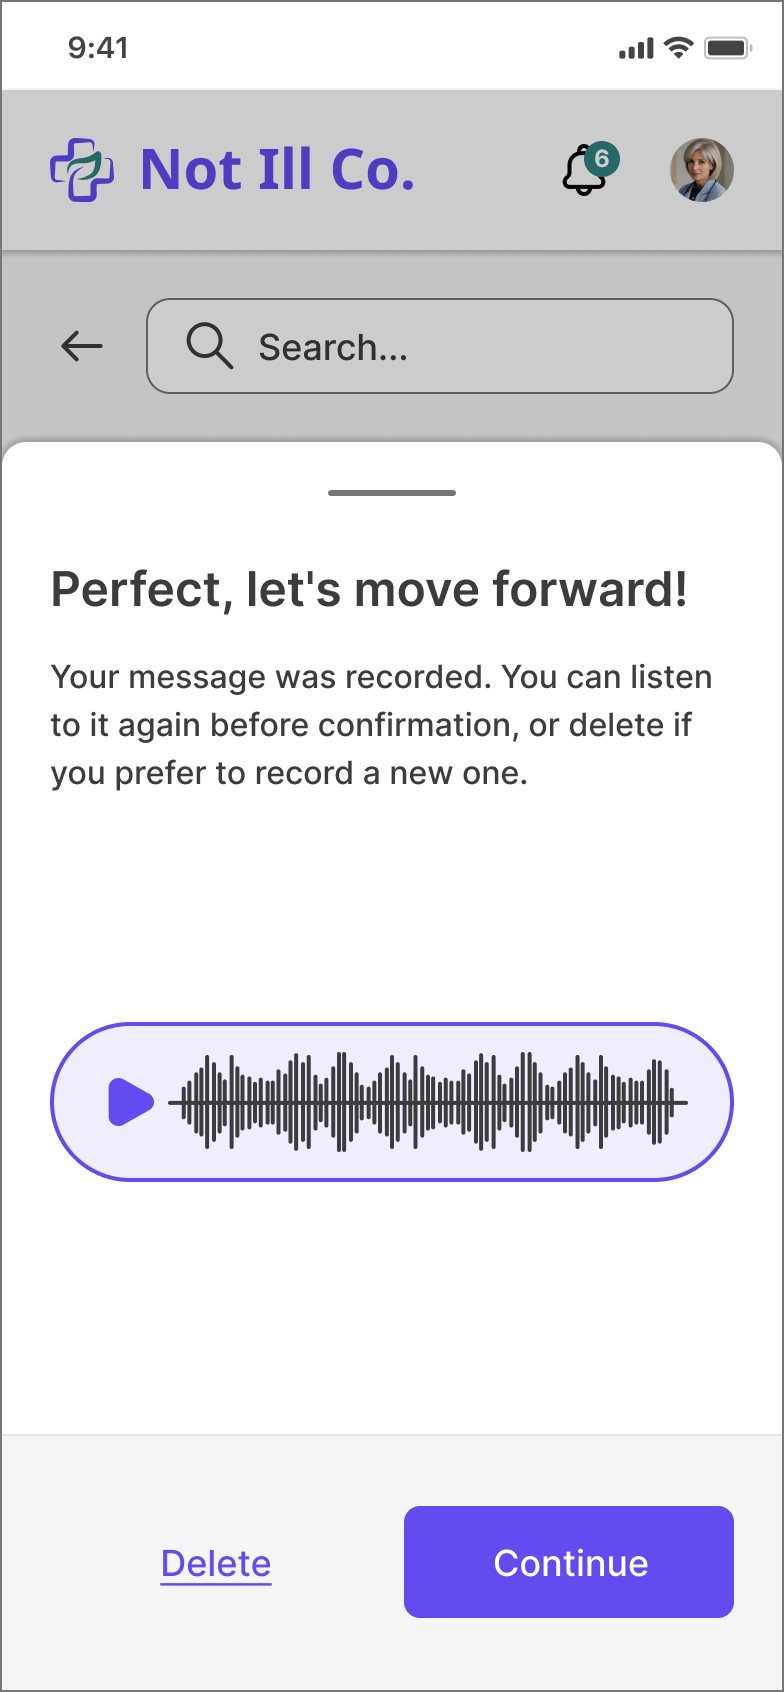
6CheckListen again, or record a new one.
7ProcessThe AI sorts it into sections.
8ReviewEdit, then add to the record.
Principle
The clinician decides
The AI suggests, the clinician confirms. Nothing reaches the record without a review.
Principle
Always a way back
Listen again, delete, edit or cancel at every step.
Principle
Sorted for you
One recording can fill several sections, like medications and clinical notes.
10The prototype
Here's the mobile flow as a prototype you can click through, built from my Figma screens. The search works for real.
Try the tasks on the right: find a patient, filter, and add information with your voice.
Not Ill Co.
00:00,00
Interactive prototype
Add a note to Israel's record
You're a doctor between two rooms. Find the patient, then dictate what you just prescribed.
Now on: Patients · list
1
Find Israel Mesquita NetoTap the search and type “mes”. Notice the highlighted letters.
2
Use one filterPick a chip like MRN or DoB. Try MRN 1010203040.
3
Record a voice noteOn his dashboard tap +, then Add with Voice + AI.
4
Review and addCheck what the AI understood, then add it to the record.
Clinicians read these screens under harsh light, tired, often at arm's length. I checked every text and background pair in the final UI against WCAG.
5.51
4.78
5.05
4.51
3.91
4.13
11.12
9.65
10.20
4.55
3.95
4.17
AA · 4.5:1
Passes AA for all text (8)AA for large text only (4)
Eight pairs pass AA for normal text. Four sit between 3:1 and 4.5:1, so I kept them for large or bold text only, like headings and buttons. In a next iteration I'd darken them so every size passes.
12Next steps and reflection
As a challenge, this wasn't built. This is how I'd take it from Figma to the wards.
Implementation
Hand-off to developers, and check technical constraints, especially for voice and AI.
Training and support
Short in-app help, because clinicians don't have time for courses.
Measure success
Track the metrics below from the first release.
Keep iterating
Test with doctors and nurses, A/B test the defaults, improve.
How I'd measure it
A plan, not results: nothing here was built or measured.
Data accessibility
Time to find a patient, and how often the first search is the right one.
Data capture
How complete records are, and how easy people say capturing is.
Efficiency
Time spent on documentation and on each task.
Error reduction
Fewer medication and documentation errors.
What I learned
Round one taught me that in a design challenge, the reviewers want to see how you think and how you design. Research earns trust only when it shows up in the screens. In round two, every screen traces back to a pain point in the journey.
What I'd do differently
I'd test with clinicians earlier. One nurse changed my mind about cards and tables in a minute. I'd also research search itself, how people look patients up today, before deciding on one filter at a time.
Related Work.
Other projects where I turned research into interfaces people can use.
Whether you’re ready to start a project or just want to chat about your ideas, feel free to reach out! I’m always open to discussing new opportunities.